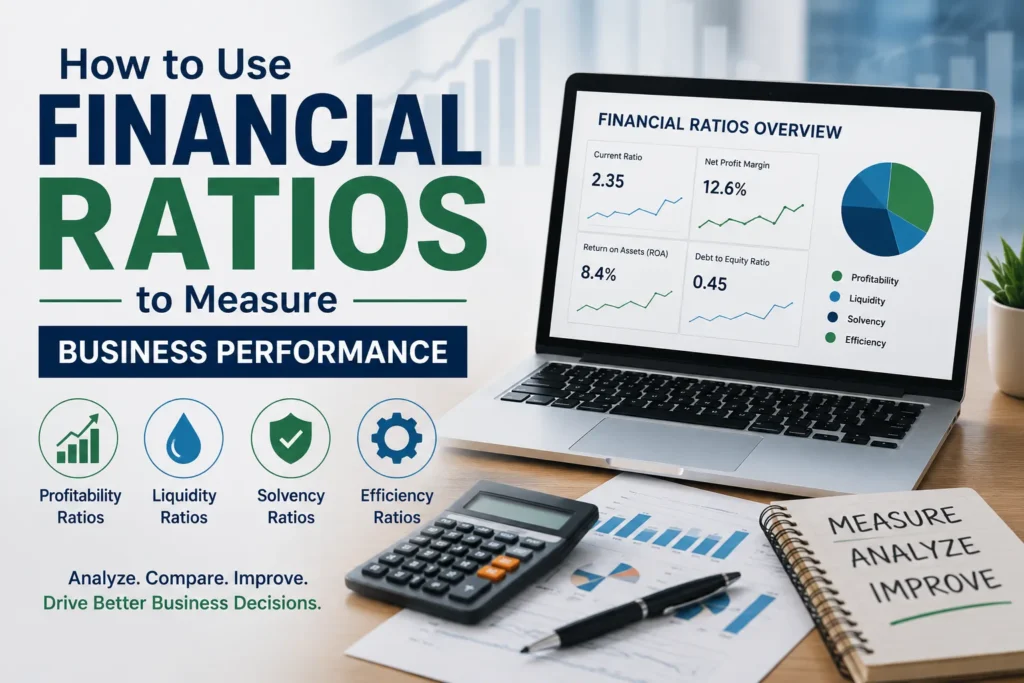
Running a business is not easy. You have income. You have expenses. Bills to pay. But how do you really know if your business is healthy? Numbers alone are not enough. That is where financial ratios come in. They turn raw numbers into something meaningful and tell you exactly what is happening.
What Are Financial Ratios?
They are simple calculations. You take one number from your financial statements. You divide it by another. The result tells a story. It tells you if you are profitable. If you can pay bills. If you are growing or shrinking. The analysis helps you understand your business. Without it, you are just guessing.
Why Financial Ratio Analysis Matters
Numbers on a page do not tell you much. You see revenue. You see expenses. But is that good or bad? Financial ratio analysis gives context.
- It compares different parts of your business.
- It shows trends.
- It spots problems before they become disasters.
Business performance depends on understanding these ratios. You cannot improve what you do not measure.
Types of Financial Ratios
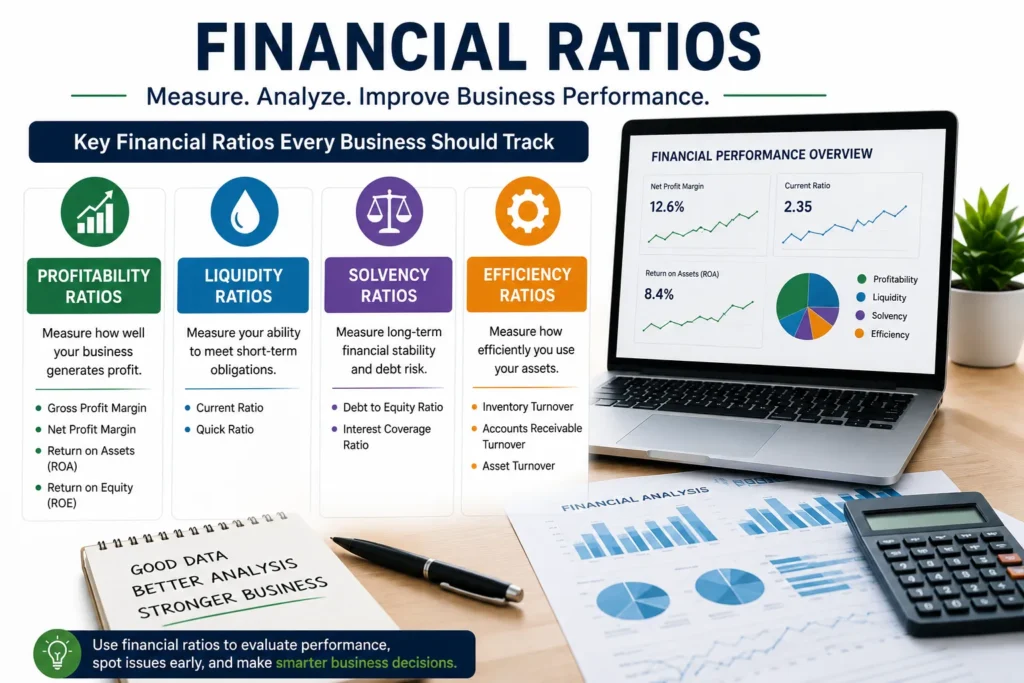
There are four main categories. Each tells you something different.
Profitability Ratios
profitability ratios tell you if you’re actually making money or just spinning your wheels. Gross profit margin is what’s left after you pay for your goods. Higher is better, plain and simple. Net profit margins are your real bottom line. That’s your true business financial health. Return on assets shows how well you’re using what you own to make profit.
Liquidity Ratios
Liquidity ratios answer one question – can you pay your bills for the next year? Current ratio is your current assets divided by current liabilities. Above 1? You’re good. You can cover what you owe. Quick ratio is stricter, it kicks out inventory. Healthy is above 1. Both tell you if you’re about to run out of cash or if you’re sitting pretty.
Solvency Ratios
Solvency ratios look at the long haul: can you handle your long-term debt or are you in over your head? Debt to equity ratio compares what you owe to what owners put in. High debt is a risky. Interest coverage ratio shows if your profits can actually cover your interest payments. These tell you if your business can survive. Too much debt kills even profitable businesses.
Efficiency Ratios
Efficiency ratios show how well you’re using your stuff. Inventory turnover knows how fast you’re selling what you buy. Faster is better. Accounts receivable turnover like how quick customers pay up. Slow payments choke your cash flow. Asset turnover on how well you use your assets to make sales. Higher is better. These ratios show if your business is running smoothly or if you’re wasting resources.
How to Use Financial Ratios
Understanding numbers is one thing. Using them is another.
Compare Over Time
Look at ratios month over month. Year over year. Are they improving or getting worse? Financial ratio analysis over time shows trends.
Compare to Industry
Your ratios do not exist in a vacuum. Compared to other businesses in your industry. If your current ratio is lower, you may have a problem.
Set Targets
Use ratios to set goals. Want to improve profitability? Set a target for net profit margin. Track it monthly.
Spot Problems Early
Dropping current ratio means cash flow problems ahead. Falling gross margin means costs are rising. Financial ratio analysis catches these early.
Make Better Decisions
Should you take on more debt? Are you profitable enough to expand? it give you data to decide.
Key Financial Ratios Explained
Current Ratio
Current assets ÷ Current liabilities.
Tells if you can pay bills in the next 12 months.
Below 1 is a red flag.
Healthy current ratio is 1.5 to 2.
Debt to Equity Ratio
Total liabilities ÷ Shareholders’ equity.
Shows how much debt you use.
Higher means more risk.
Too high makes lenders nervous.
Net Profit Margin
Net profit ÷ Revenue.
Shows real profitability.
Low means prices are too low or costs too high.
Inventory Turnover
Cost of goods sold ÷ Average inventory.
Shows how fast you sell stock.
Low means you are holding too much inventory.
Ties up cash. Increases storage costs.
What Good Financial Health Looks Like
Healthy Profitability
– Gross profit margin is stable
– Net profit margin above industry average
– Return on assets is growing
Healthy Liquidity
– Current ratio above 1.5
– Quick ratio above 1
– Can cover unexpected expenses
Healthy Solvency
– Debt to equity ratio is reasonable
– Interest coverage ratio is comfortable
– Not over-leveraged
Healthy Efficiency
– Inventory turnover is consistent
– Receivables collected quickly
– Assets generating good returns
Conclusion:
Financial ratios are tools. Tools that help you understand your business. They show strengths. Weaknesses Where to improve. Business performance depends on using these tools. You cannot manage what you do not measure.
Financial statement analysis is for business owners. Start using ratios today.
Frequently Asked Questions
What are financial ratios?
They are calculations comparing numbers from financial statements. They measure business performance, profitability, liquidity, and efficiency.
What is ratio analysis?
The analysis interprets ratios to evaluate company performance. It assesses business financial health and identifies improvements.
What are profitability ratios?
Profitability ratios measure profit generation. Examples include gross profit margin and net profit margin. They show if your business makes money.
What are liquidity ratios?
Liquidity ratios measure ability to pay short-term debts. The current ratio and quick ratio are common. They show cash availability for bills.
What is a current ratio?
The current ratio is current assets divided by current liabilities. It tells if you can pay short-term debts. Above 1.5 is healthy.
What are solvency ratios?
Solvency ratios measure ability to pay long-term debts. Debt to equity and interest coverage ratios show long-term sustainability.
What are efficiency ratios?
Efficiency ratios measure asset usage. Inventory turnover and asset turnover show how smoothly your business runs.
How do financial ratios help business performance?
It reveals strengths and weaknesses. They help spot problems early, make decisions, and improve business financial health.
What ratios should I track?
Track current ratio, debt to equity, net profit margin, and inventory turnover. These cover liquidity, solvency, profitability, and efficiency.
How often should I do ratio analysis?
Do financial statement analysis monthly or quarterly. Regular financial ratio analysis catches issues early and tracks business performance.